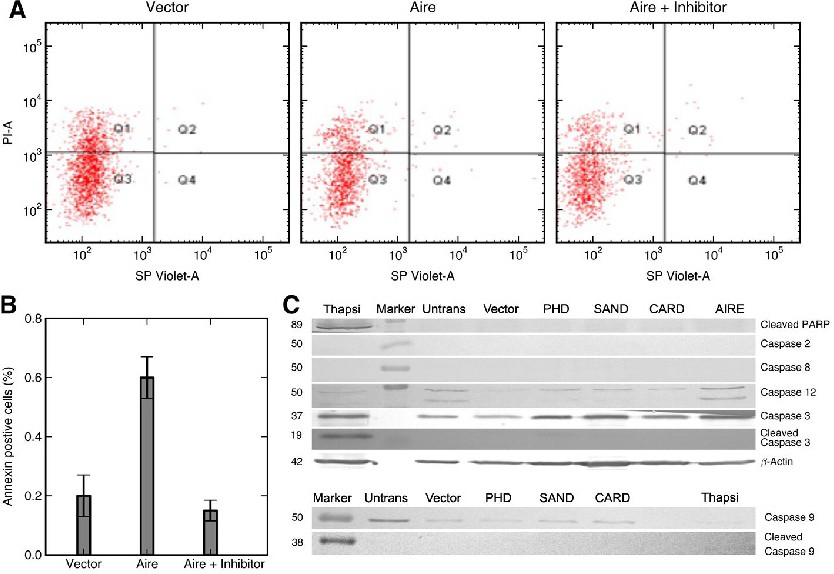
Fig. 7. (A) Dot plot showing reduction in annexin positivity of Aire expressing cells treated with general caspase inhibitor Z-VAD-FMK. GC1 cells over expressing GFP and untreated Aire expressing cells are taken as controls. (B) Percentage of annexin positive cells in cells transfected with Aire pre-treated with and without caspase inhibitor. Data from two independent transfection represented as Mean ± SEM. (C) Caspase-2,3,8,9,12 cleaved PARP and cleaved caspase 3 expression in total lysate from GC1 cells (untransfected and empty vector controls - negative controls), thapsigargin-treated cells (positive control) and cells transfected with full length AIRE, PHD, SAND and CARD constructs.